MeetingPulse Reporting and Analytics delivers powerful, real-time insights that go far beyond the basic reporting features of lesser engagement tools. Designed for organizations that need to measure and act on audience engagement with precision, MeetingPulse provides a live analytics dashboard that tracks poll participation rates, survey completions, Q&A activity, and sentiment trends throughout your meeting or event. Whether you’re running a live conference, virtual advisory board, or hybrid training session, you can monitor attendee interactions in real time and export detailed post-event reports for analysis.
One standout feature is MeetingPulse’s proprietary Pulse module, which captures live sentiment data to help you track audience mood, engagement spikes, and emotional highs and lows across your sessions. This kind of sentiment tracking is not available in Slido or Mentimeter and is especially valuable in medical education, pharma engagement, and internal communications where audience tone matters. MeetingPulse also provides exportable reports in multiple formats—including Excel, CSV, and PDF—containing poll results, time-stamped engagement activity, and either anonymous or credentialed participant responses depending on your configuration.
For industries that require compliance, such as healthcare, life sciences, and government, MeetingPulse offers audit-ready reporting that includes detailed voting records, voter authentication logs, and timestamped data trails. These audit reports ensure full transparency for secure, credentialed decision-making, setting MeetingPulse apart from other polling tools that do not support compliance-grade workflows.
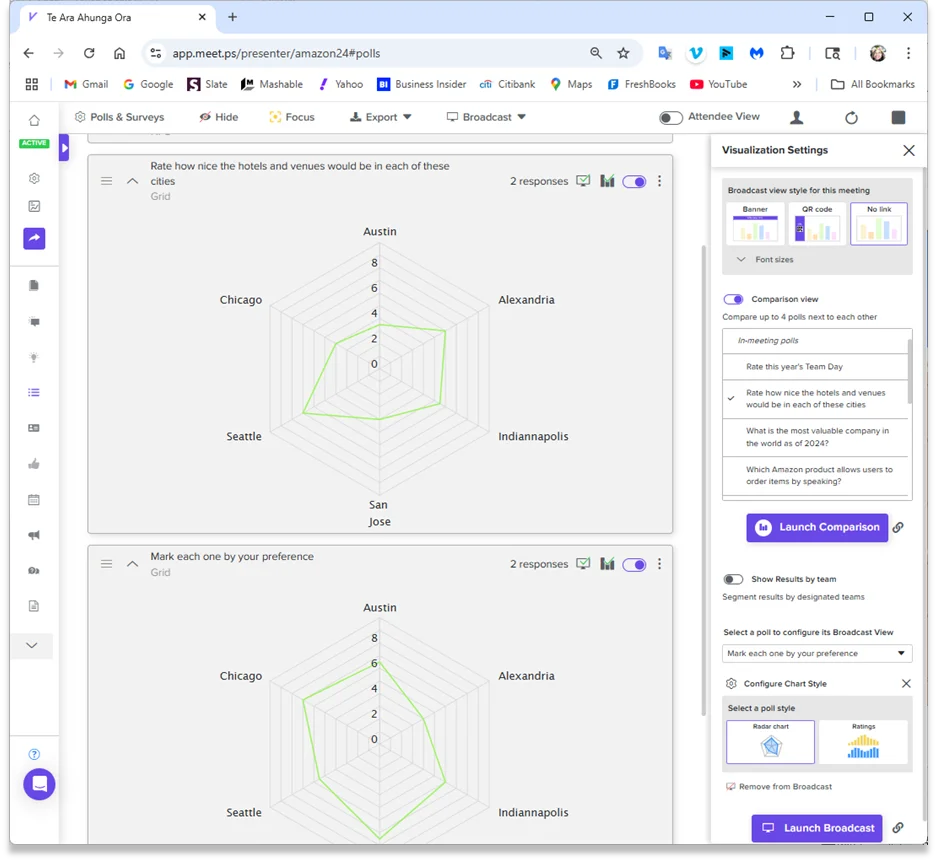
Advanced feedback is visualized through radar chart analysis, allowing teams to quickly interpret complex data such as skill assessments, speaker evaluations, or structured feedback from healthcare professionals. Additionally, MeetingPulse automatically compiles post-event summary reports, making it easy to deliver session-by-session engagement overviews, top Q&A themes, and actionable insights to stakeholders. The platform’s privacy-first design supports both anonymous participation and identifiable reporting, giving organizers the flexibility to meet regulatory requirements without sacrificing interactivity.
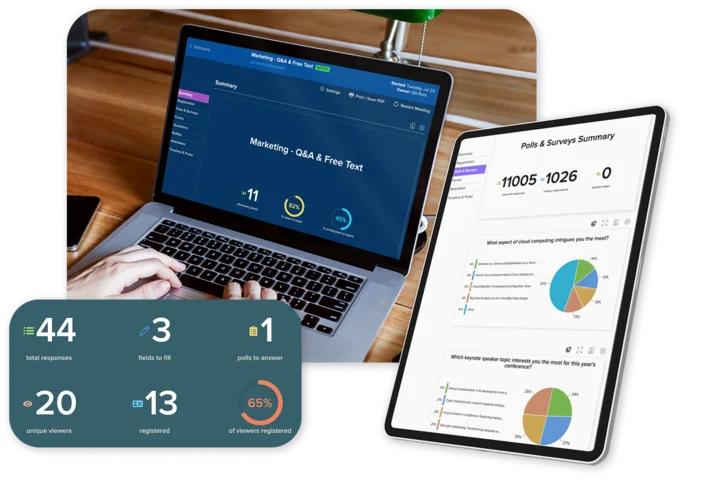
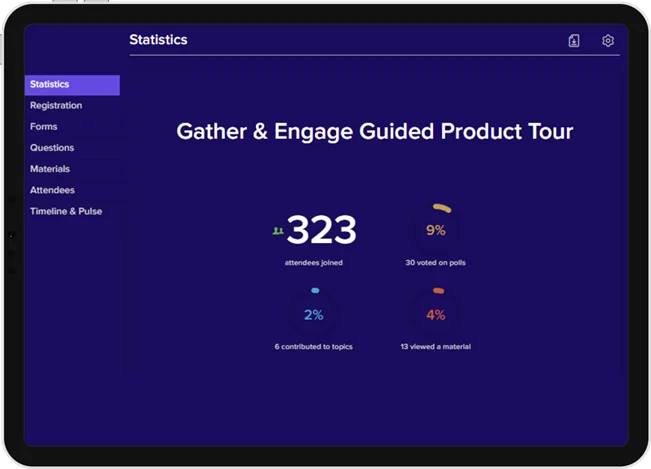
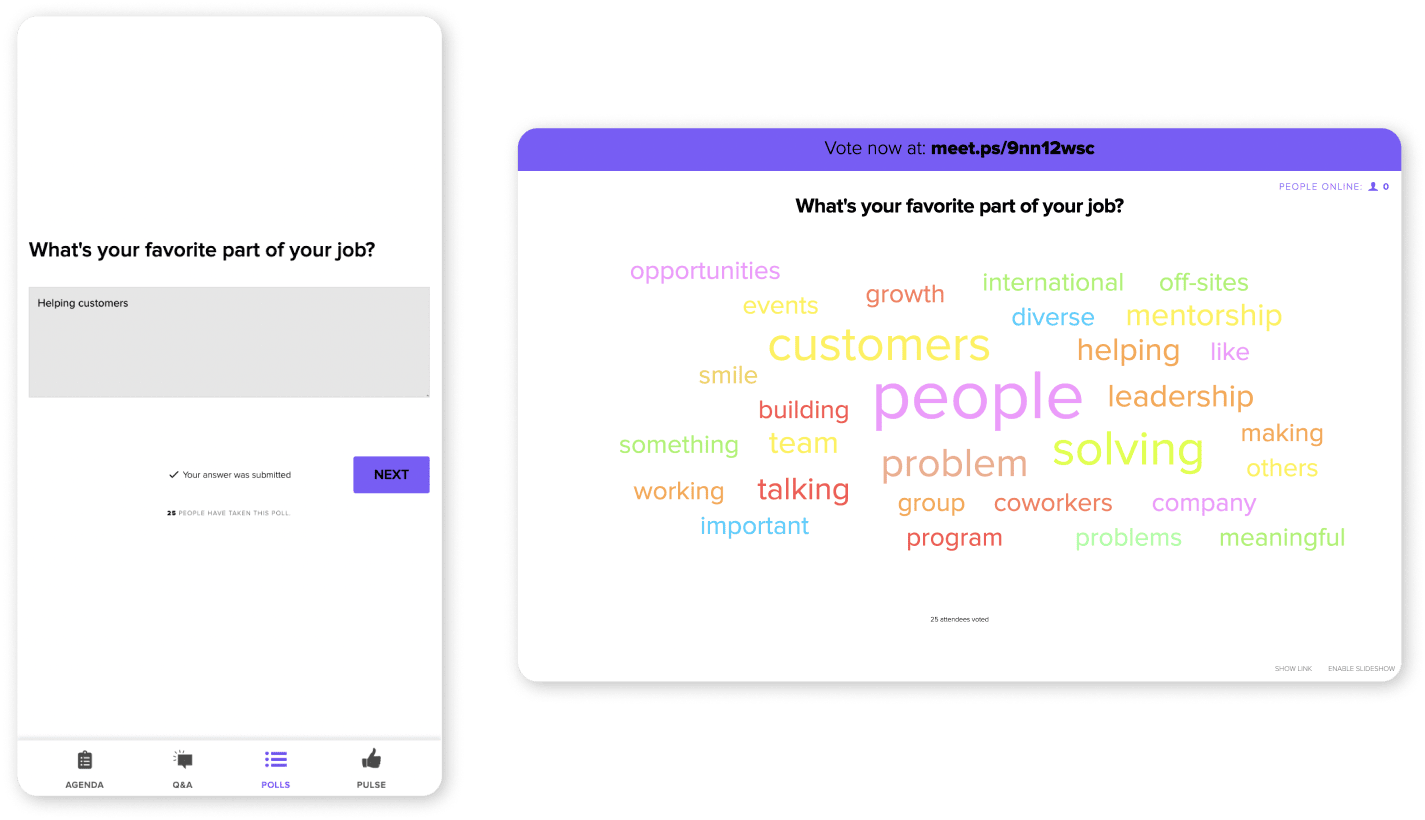
Live Results at Your Fingertips
Live participation tracking across modules (polls, Q&A, surveys, feedback, etc.)
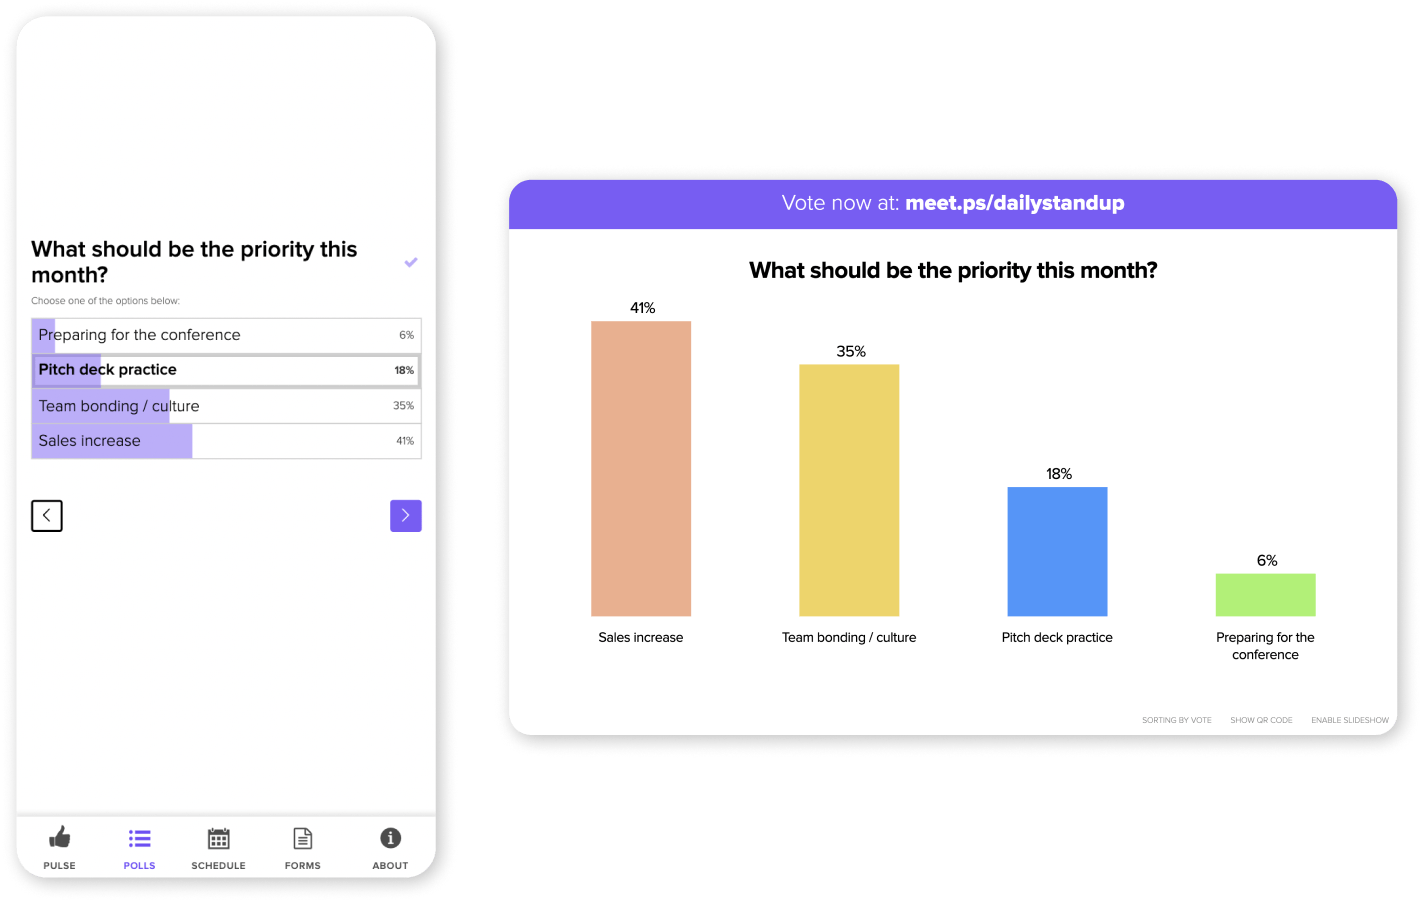
Engagement results showing activity throughout the session
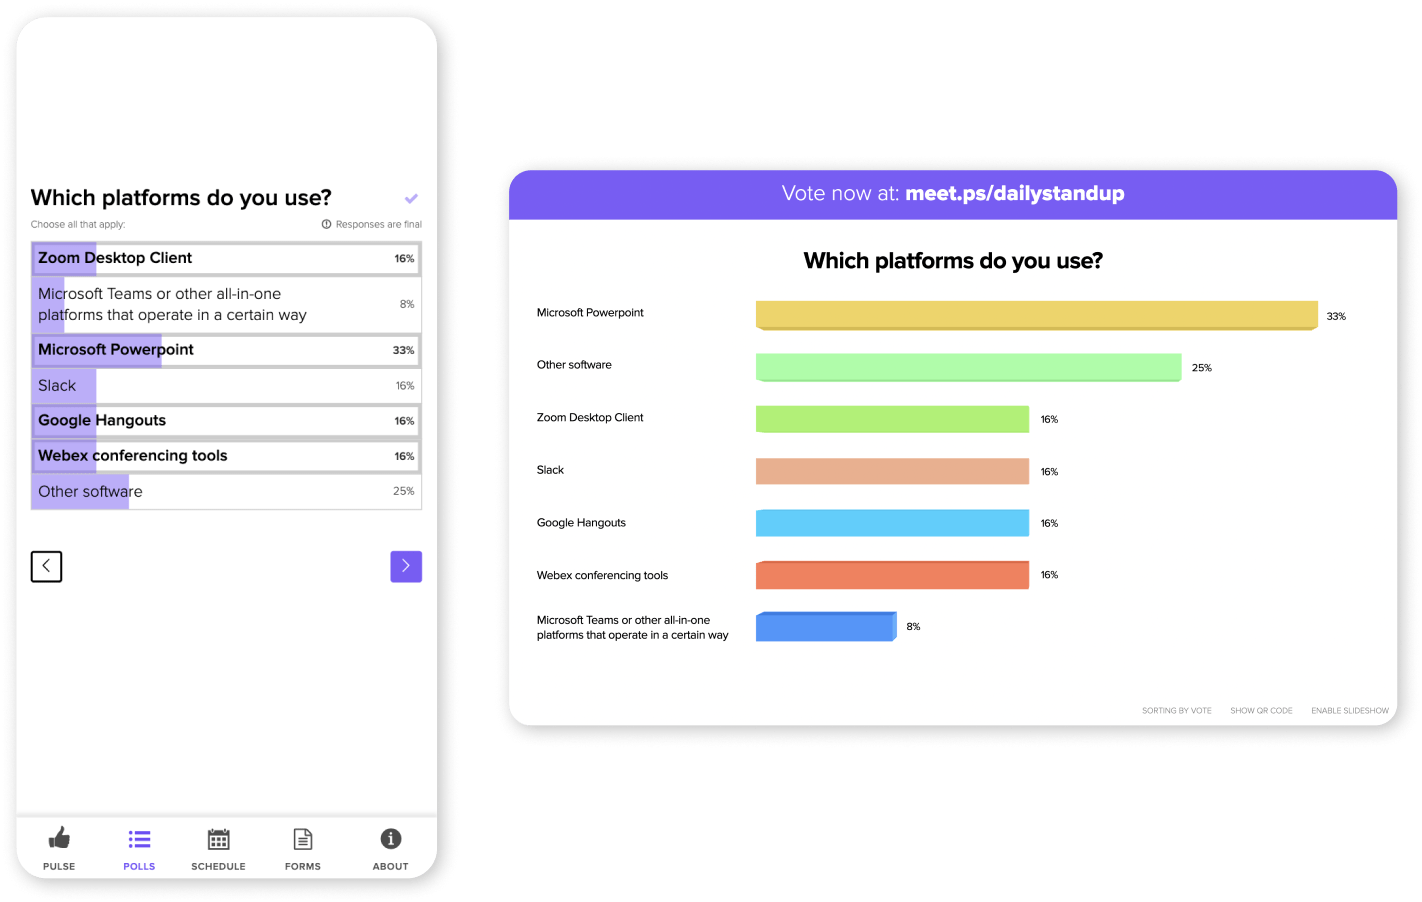
Response rates by poll or question
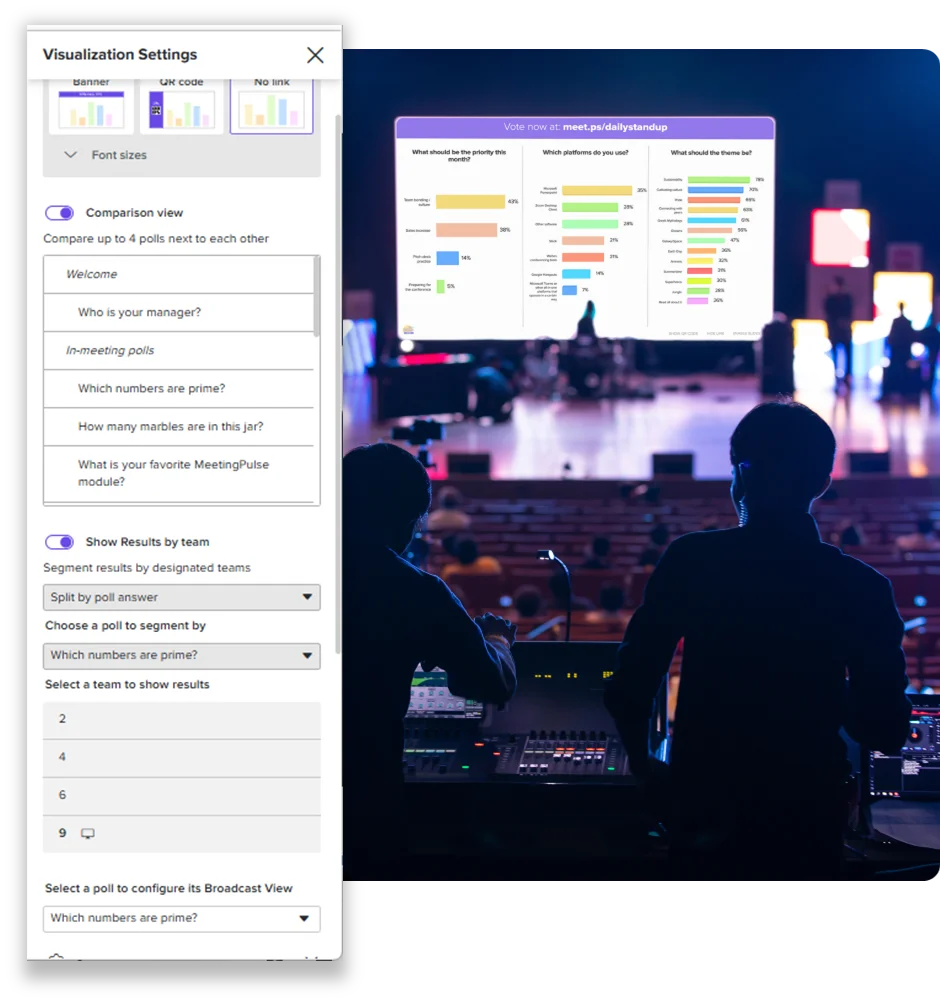
Broadcast controls
Results visualization configuration panel
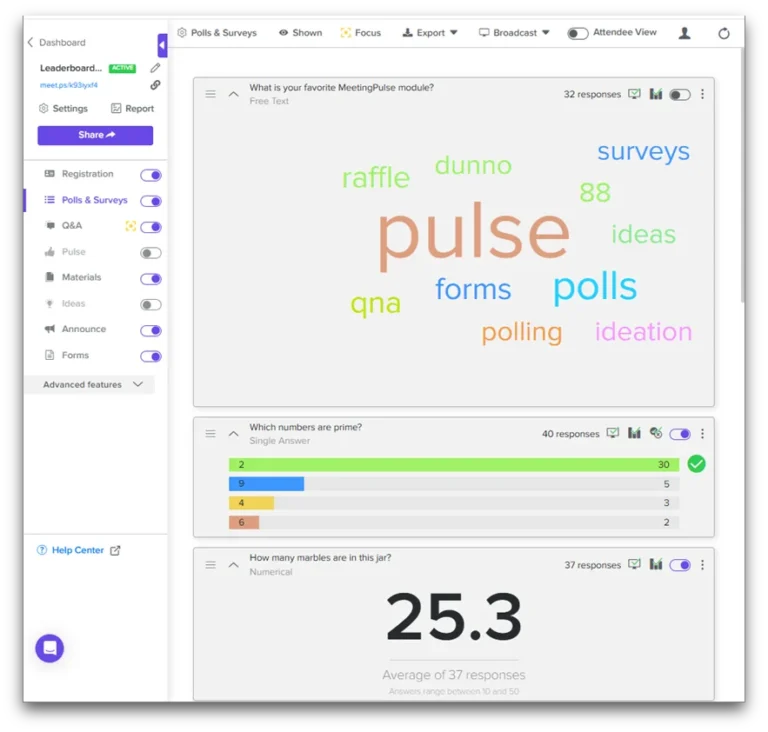
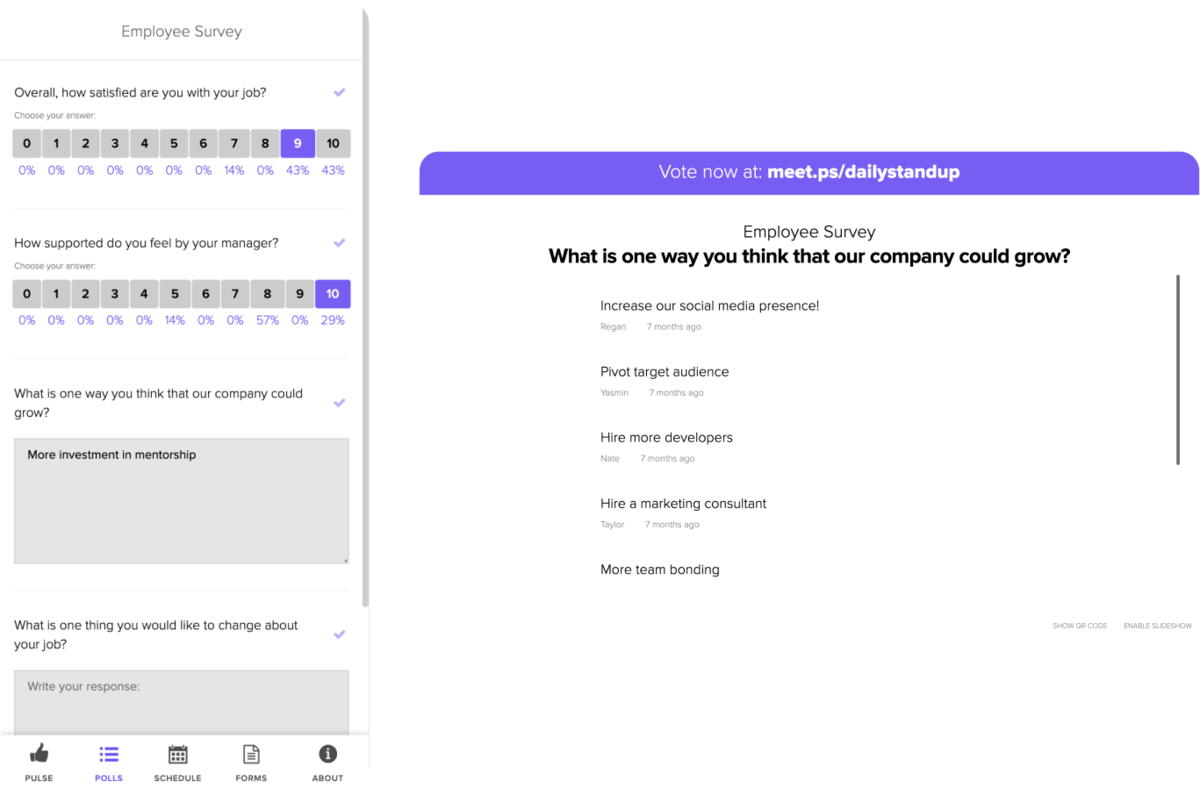
Comprehensive Tracking & Metrics
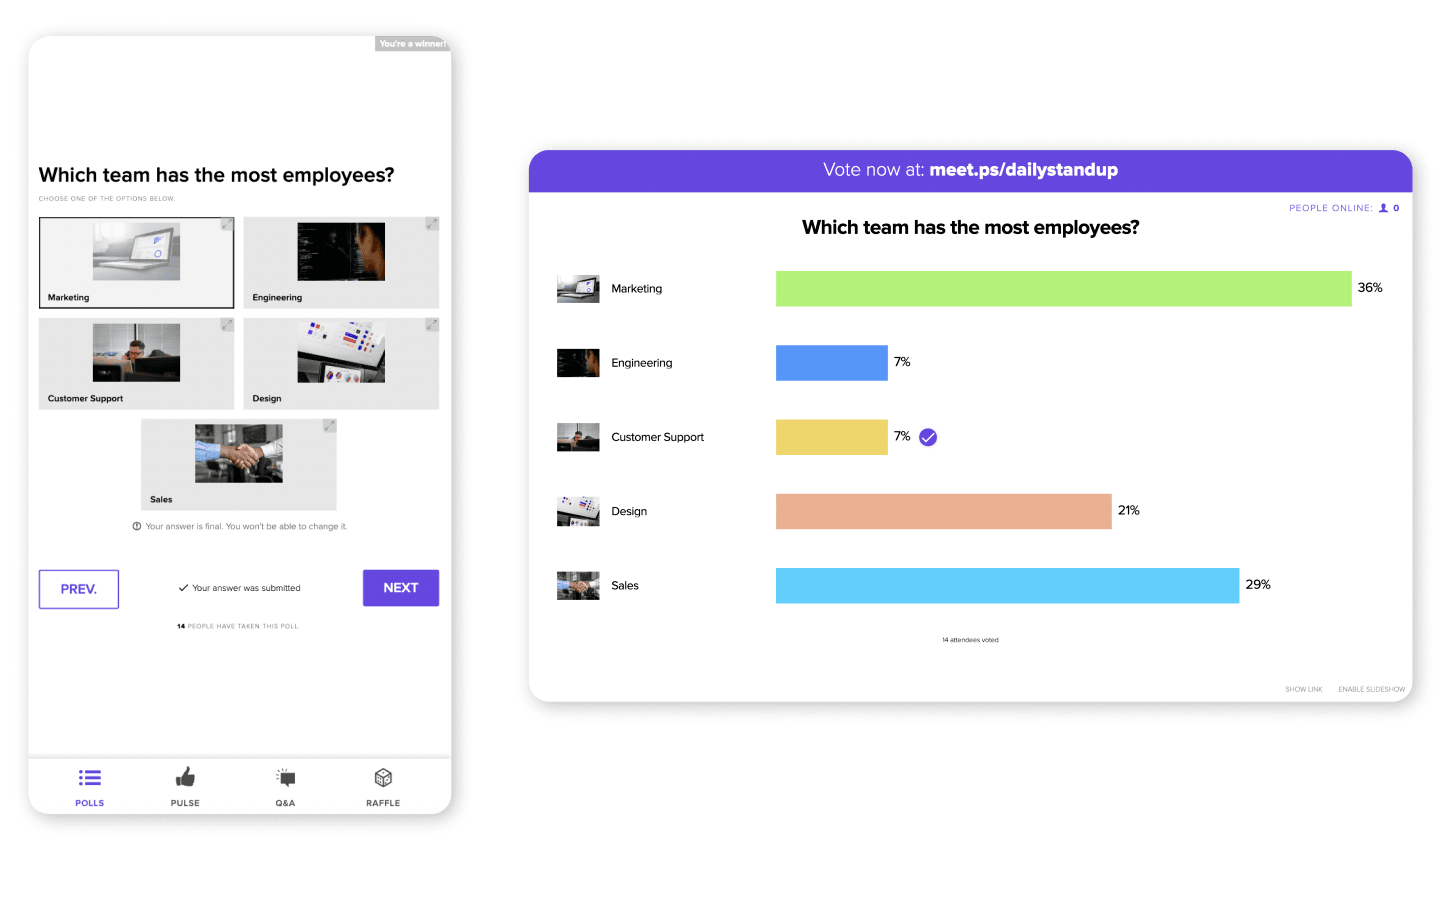
Response Rates: See how many attendees participated vs. how many were present.
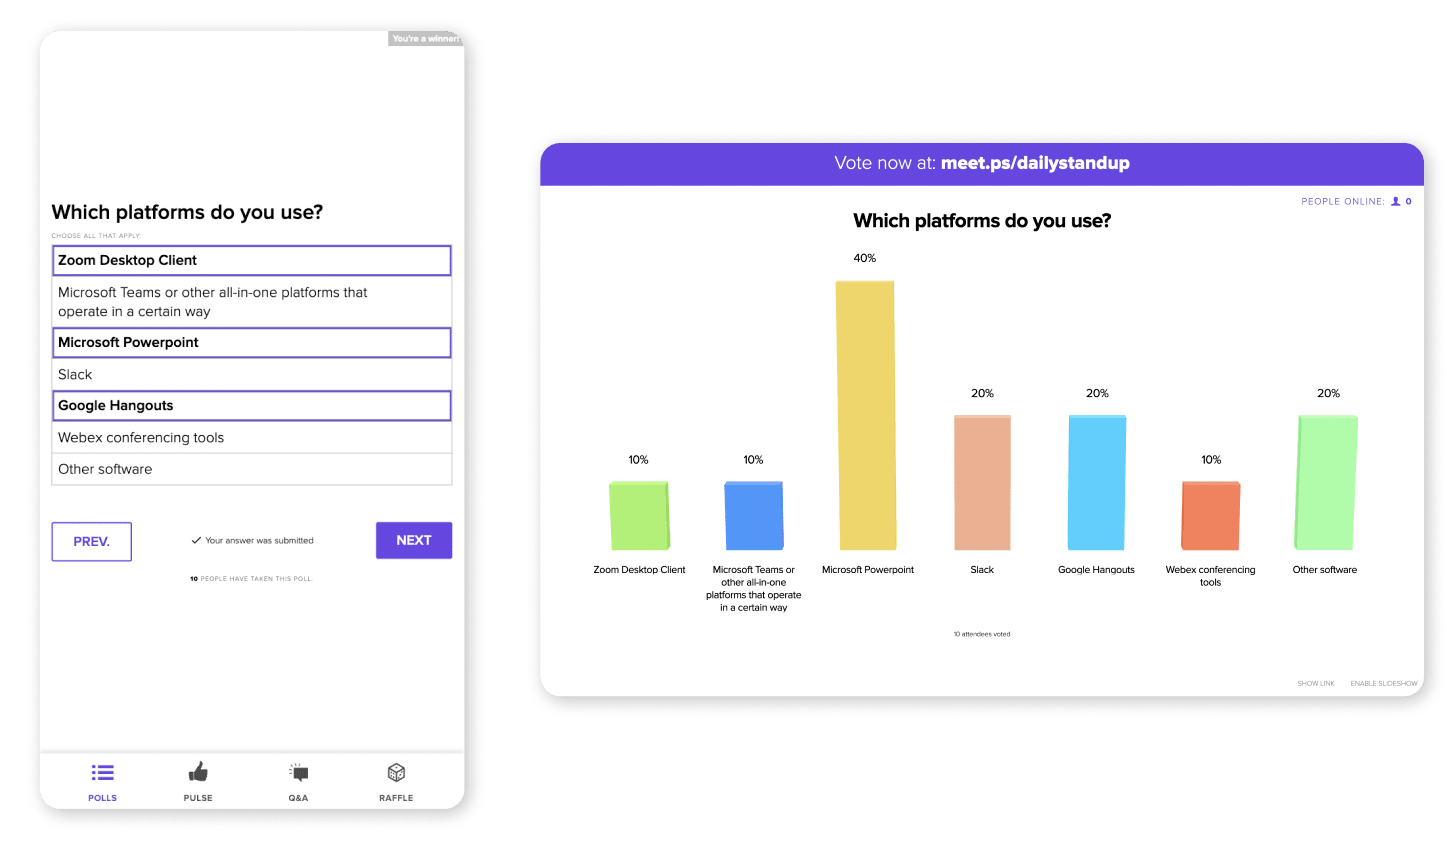
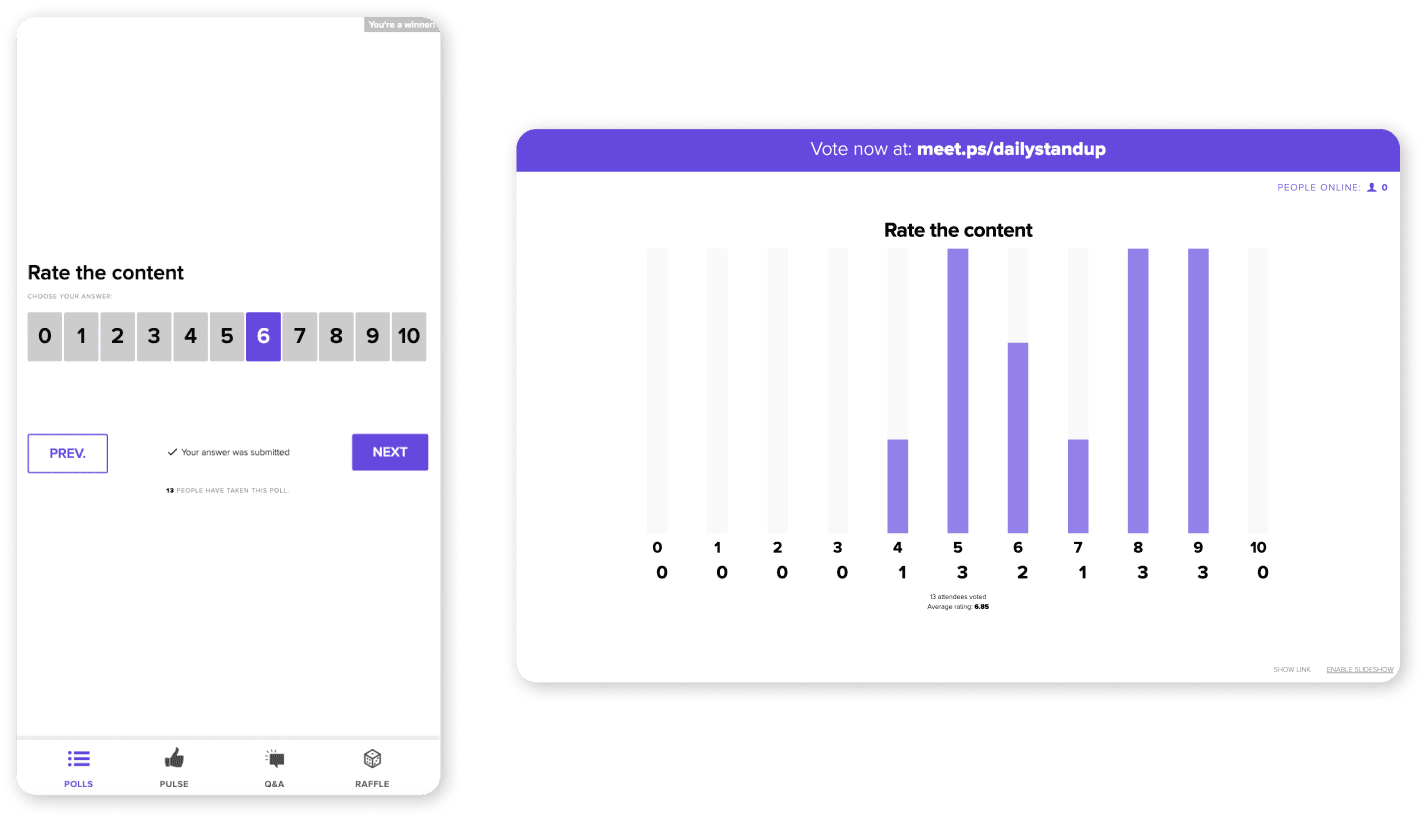
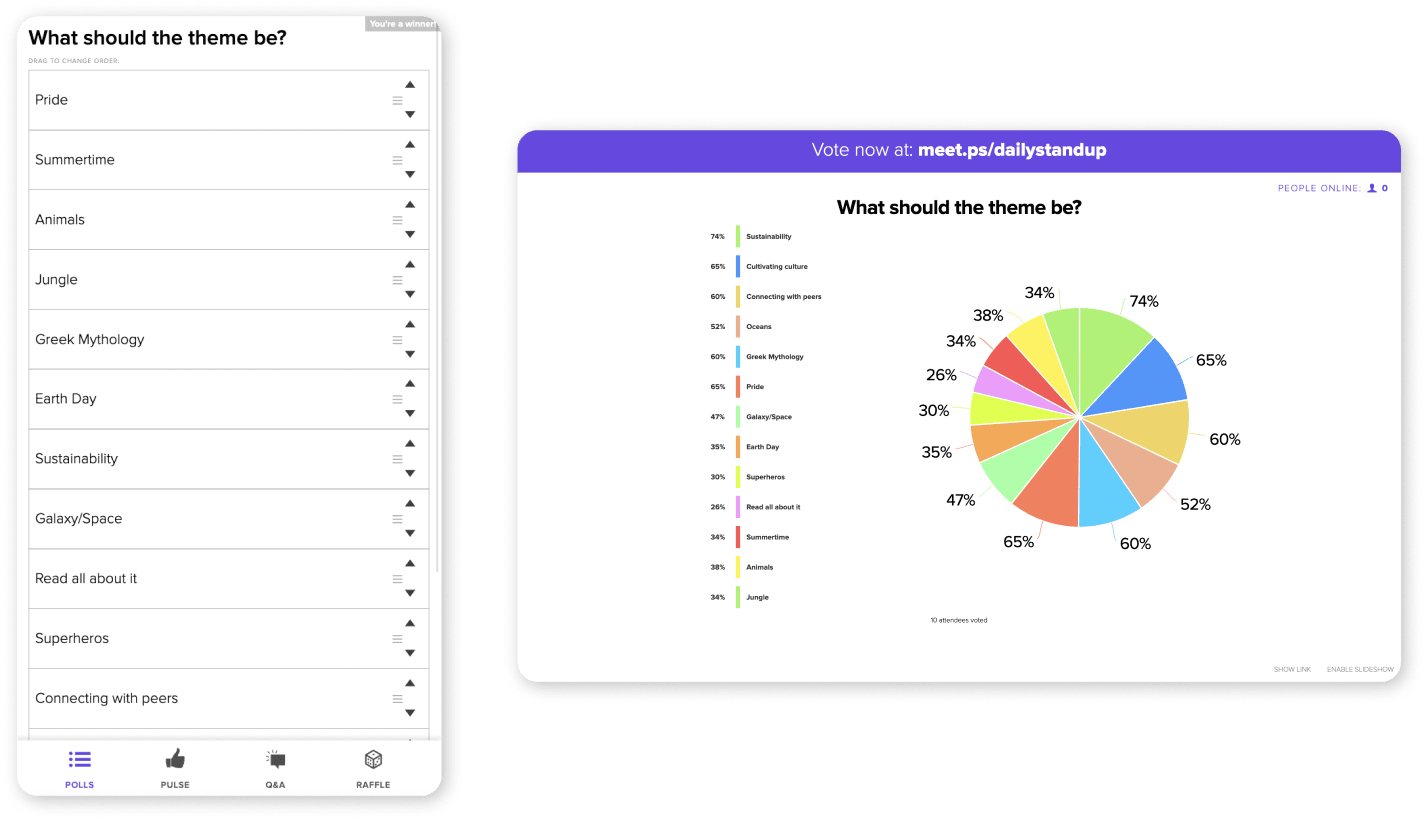
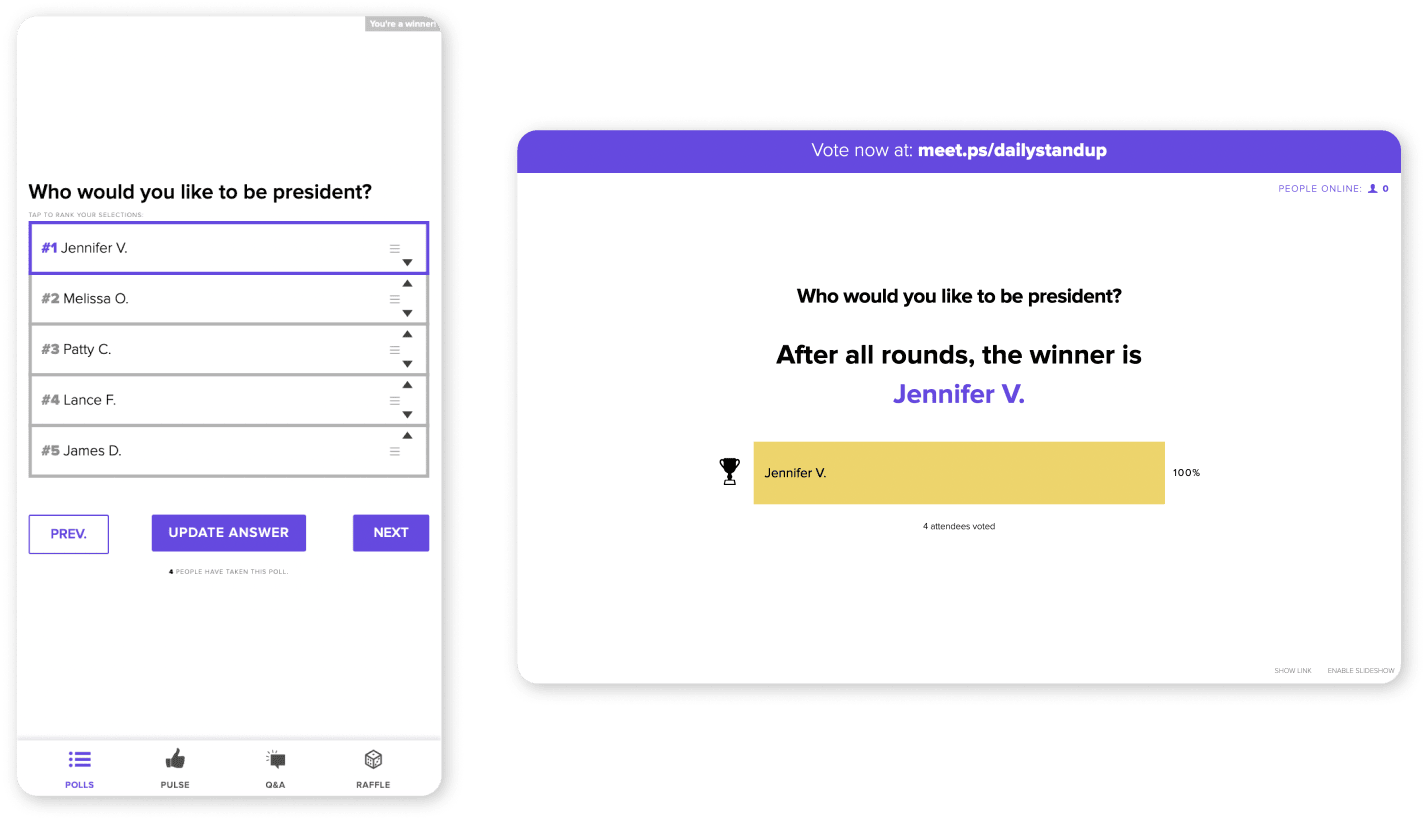
Results Summary: Aggregated results in bar, pie, or list formats.
User Responses (if not anonymous): Track who answered what, ideal for training or credentialing.
Time-stamped Participation: Know exactly when participants responded.
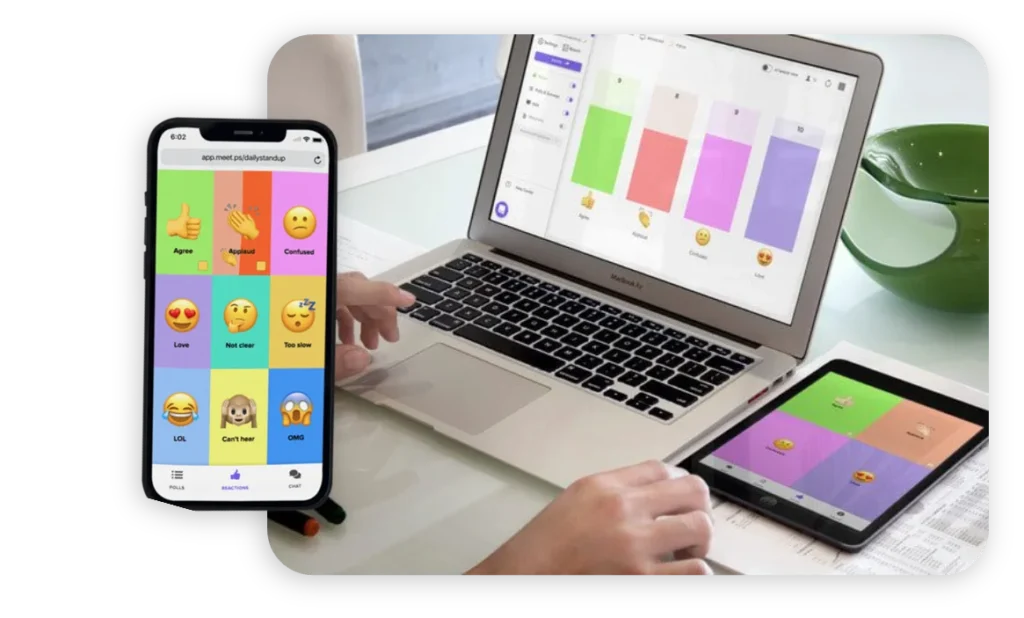
Live Sentiment Analysis
Number of sentiment inputs in real time
“Hot” moments of high engagement (positive or negative) show overall emotional trajectory of the session
Time-stamped data aligns audience emotion with specific agenda items, slides, or speakers
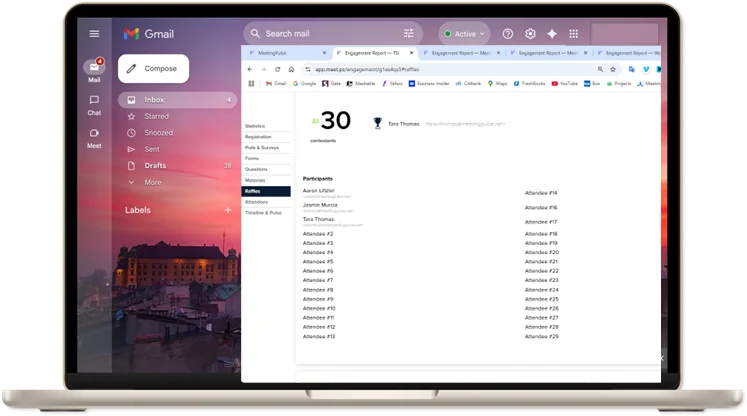
Drill Down to View Key Individual Participant Data
View reporting data tied to participants by name or attendee number
See responses by attendee in a comprehensive view
See raffle results from each draw
View themed, graphical PDFs of participant results
Download CSVs to further sort and filter
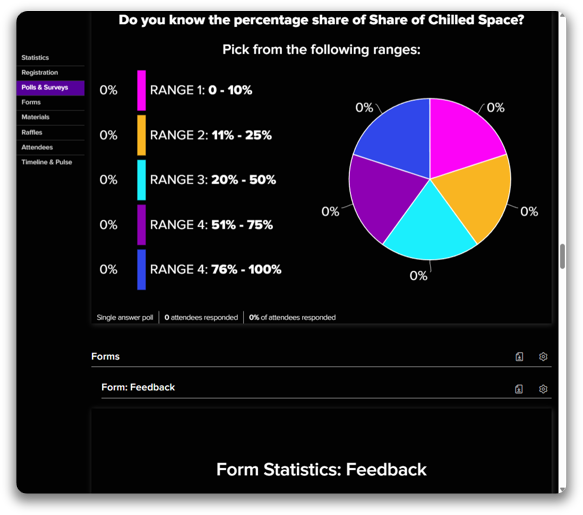
Understand Your Meeting Metrics
The Audit Report gives a complete and verifiable record of all session activity
Responses, survey data, feedback entries
Voter and proxy reporting
Q&A submissions, deletions, and moderator actions
Full summaries of responses and sentiment tracking
Compare Responses Across Multiple Polls
Choose 4 polls to compare data
Display on one broadcast view screen
Compare responses by group or segment
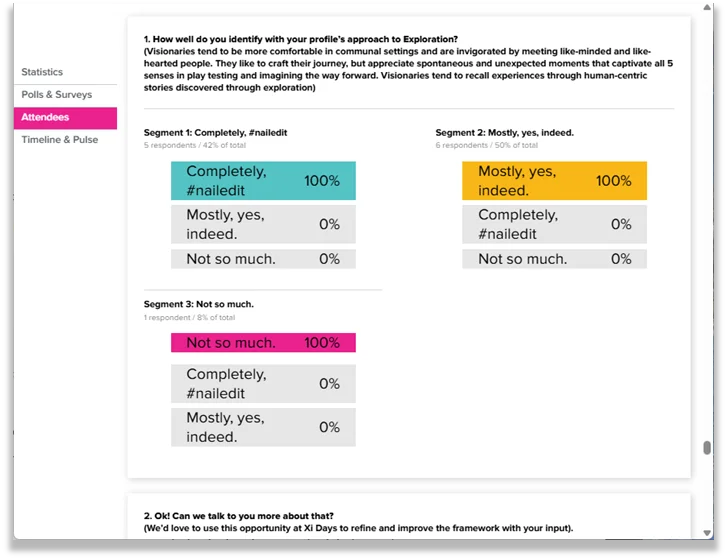
View Results by Group or Identified Segment
Use Registration and conditional data to easily identify segments
Push multiple votes and polls to segmented groups within one meeting and view results in real time
View responses by segment in Broadcast View or in the Engagement report
Configure views for comparison and analysis
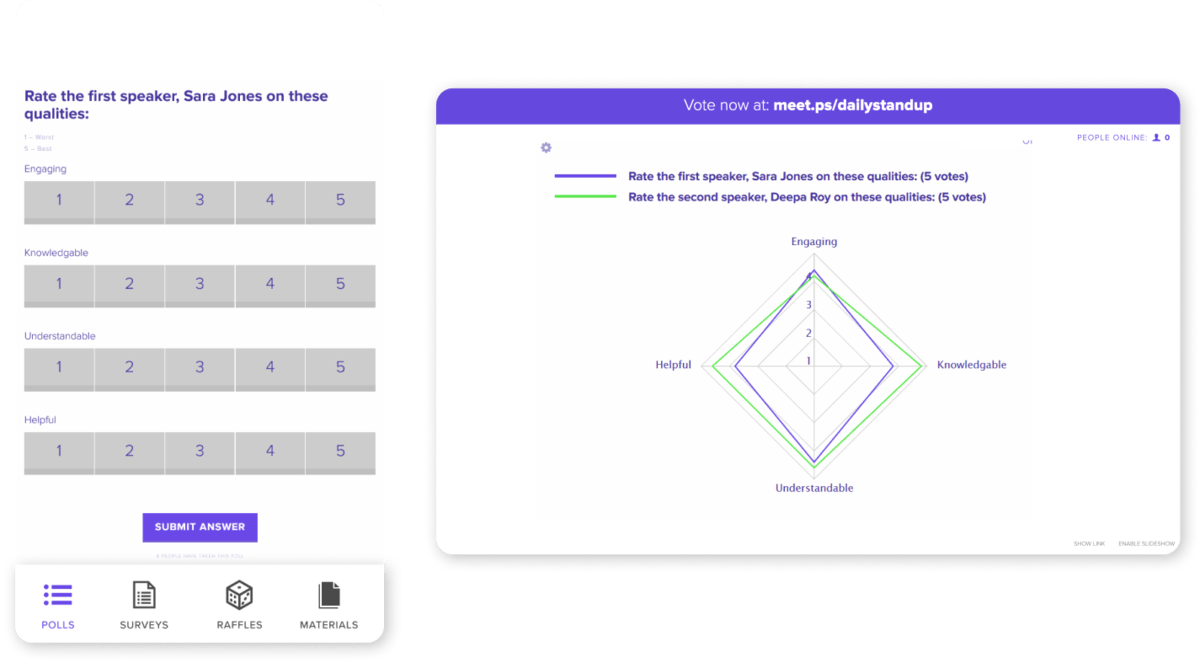
Visualize Multidimensional Feedback Data
Each axis represents a category or question, and the shape of the polygon shows how balanced or skewed the responses are
Ready to see MeetingPulse Reporting & Analytics in action?
Radar charts are used to display the results of Grid or, Multi-Rate Polls
Activate any audience with this comprehensive platform that can address any communications, response, feedback or voting scenario and integrates with meeting technology leaders:
Manage Consent
To provide the best experiences, we use technologies like cookies to store and/or access device information. Consenting to these technologies will allow us to process data such as browsing behavior or unique IDs on this site. Not consenting or withdrawing consent, may adversely affect certain features and functions.
Functional
Always active
The technical storage or access is strictly necessary for the legitimate purpose of enabling the use of a specific service explicitly requested by the subscriber or user, or for the sole purpose of carrying out the transmission of a communication over an electronic communications network.
Preferences
The technical storage or access is necessary for the legitimate purpose of storing preferences that are not requested by the subscriber or user.
Statistics
The technical storage or access that is used exclusively for statistical purposes.The technical storage or access that is used exclusively for anonymous statistical purposes. Without a subpoena, voluntary compliance on the part of your Internet Service Provider, or additional records from a third party, information stored or retrieved for this purpose alone cannot usually be used to identify you.
Marketing
The technical storage or access is required to create user profiles to send advertising, or to track the user on a website or across several websites for similar marketing purposes.